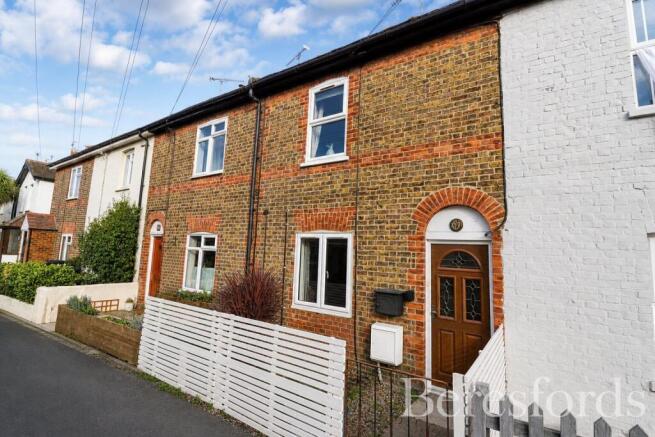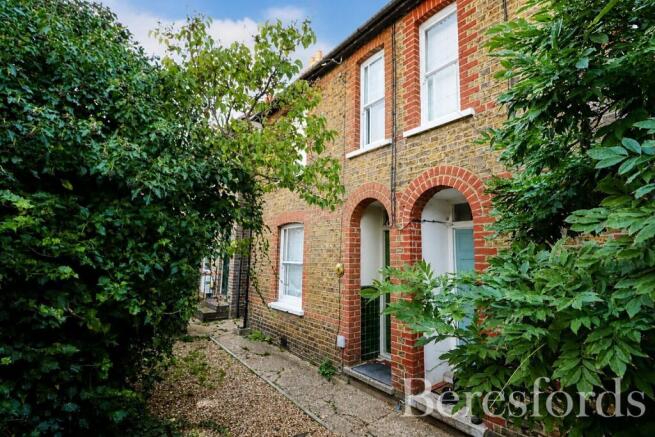
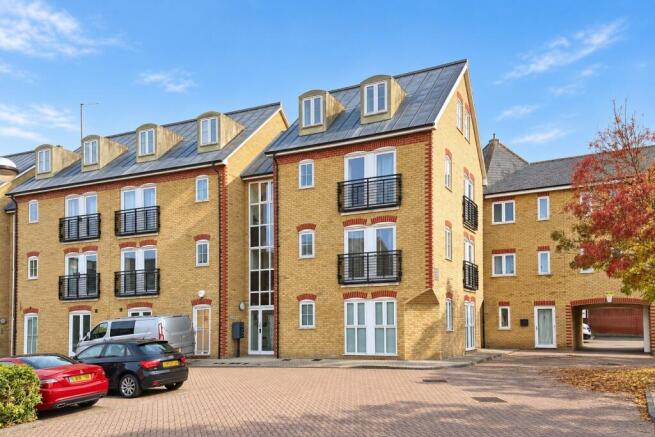
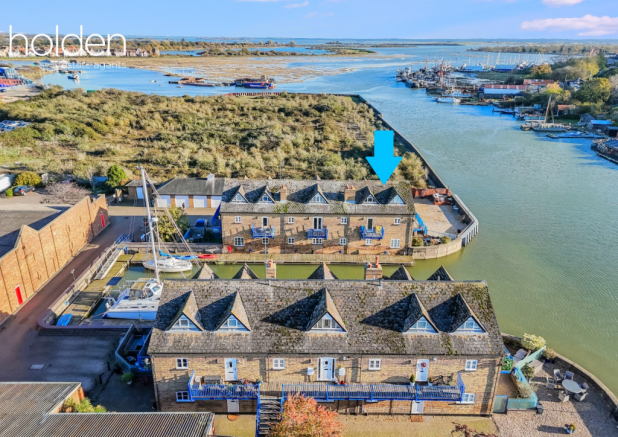
What is the average house price in Maldon North?
The median sold price in Maldon North over the last twelve months was £305,000 across 79 sales; over five years it was £300,000.
Neighbourhood in Maldon · 2,234 homes with a recorded sale · 4,591 sales
| Terraced | £289,250 | 168 sales |
| Flat | £190,000 | 153 sales |
| Semi-detached | £340,000 | 153 sales |
| Detached | £525,000 | 94 sales |
Boundary: 2021 census middle layer super output area (MSOA) E02004558, the unit of about 8,000 residents the figures below add up.
Named localities this neighbourhood belongs to
Named places whose map point lies in this neighbourhood
Homes listed for sale and to let now inside the boundary (shared ownership and land left out) with the median asking price; the newest listings matched to a home link to its page
Standard sales, newest first
Streets with the most sales (five or more)
Postcode districts covering Maldon North
Official figures for the 4 neighbourhoods (LSOAs) Maldon North's homes lie in. Council: Maldon.
Official house price index, September 2026: a mix-adjusted average for a typical home in the council area, not the mean of the month's sales
The median sold price in Maldon North over the last twelve months was £305,000 across 79 sales; over five years it was £300,000.
Maldon North is a neighbourhood in Maldon: the 2021 census middle layer super output area E02004558, home to about 6,907 people. The name is the House of Commons Library's.
Maldon North is part of Maldon.
The official house price index puts the average home in Maldon at £406,165 in September 2026: up 5.0% on a year earlier and up 12.8% over five years.
The police recorded 764 crimes in Maldon North's neighbourhoods in the 12 months to September 2026 — 110.6 per 1,000 residents, against 98.4 across England and Wales. The most common was Violence and sexual offences.
Band D in Maldon is £2,328 a year for 2026-27. The most common band among Maldon North's homes is band C (33.5% of dwellings).
Maldon North's neighbourhoods have 3 state primary and 1 secondary schools; 3 of the 3 with an Ofsted grade on record are rated good or outstanding.
Neighbourhood names and boundaries: official open data — see Sources & copyright.
Standard registered sales. Contains HM Land Registry data © Crown copyright and database right 2026, licensed under the Open Government Licence v3.0.
uHouse · Sources and methods: methodology
Official private rents index, October 2026: average monthly rent of private tenancies in the council area
3,490 dwellings by council tax band, with Maldon's 2026-27 charge for each band
Charges are the council's Band D scaled by the fixed band ratios (A = 6/9 of D … H = 18/9); a home's own band is on the Valuation Office Agency register.
State primary and secondary schools in Maldon North's neighbourhoods, best latest exam results first · Ofsted outcome · exam results (England)
3 schools · Ofsted: 0 outstanding, 2 good, 0 requires improvement, 0 inadequate · 1 inspected under the new report cards (no overall grade)
1 schools · Ofsted: 0 outstanding, 1 good, 0 requires improvement, 0 inadequate
Crimes recorded by the police in Maldon North's neighbourhoods, October 2025 – September 2026
Neighbourhoods are drawn to hold similar numbers of residents, but town-centre ones also count crimes against shoppers and visitors, so their totals run high. Crimes on trains, the Underground and at stations (recorded by British Transport Police) are not included.
Where the neighbourhoods rank in their nation's index of multiple deprivation, which combines income, employment, education, health and more, by decile (1 = most deprived 10%)
4 neighbourhoods in Maldon North
Census 2021: 6,907 residents and 3,319 households, beside England & Wales
Average share of premises per postcode able to get each service; outdoor 4G / 5G coverage of premises in Maldon
Homes in an area at risk of flooding from rivers or the sea, allowing for flood defences
Official river and sea flood risk: homes in a high, medium or low risk area out of 3,490 dwellings; 32 more are at very low risk (under 0.1% a year).
Surface-water flooding from heavy rain is not included.
Sources: open data published by UK public bodies — see Sources & copyright for the attribution.